Вопросы и ответы читателей | Как вычислить функцию потока в Python
Добрые советы
Поскольку код визуализации слишком длинный и скрыт, вы можете нажать «Запустить вилку», чтобы просмотреть его. Если визуализация не загружается успешно, нажмите «Выполнить», чтобы просмотреть ее. PS: Скрытый код находится в строке [Код скрыт]. Нажмите на строку, и вы увидите самый правый угол строки. Нажмите, чтобы просмотреть.
Предисловие
Функция потока является важной концепцией в метеорологии. Она может помочь нам понять и проанализировать характеристики поля ветра. Особенно в случае двумерного безвихревого потока функция потока может полностью описать состояние потока. Метеорологам необходимо освоить метод расчета функции потока, поскольку он помогает повысить точность прогнозов погоды и понимание изменения климата.
Цели проекта
Основная цель этого проекта — решить проблему расчета функции потока в метеорологических расчетах. Предоставляя несколько различных методов расчета функций потока, исследователи могут обрабатывать метеорологические данные более гибко и эффективно.
проектный подход
В этом проекте мы представляем три основных метода расчета функций потока:
metpy: решение функции потока Монтгомери Windspharm: сферические гармоники (или сферические гармоники), использующие быстрое преобразование Фурье (БПФ) для решения уравнений. xinvert: решить уравнение Пуассона, используя метод последовательной сверхрелаксации (SOR).
Установка и импорт библиотек
!pip install windspharm -i https://pypi.mirrors.ustc.edu.cn/simple/!pip install xinvert -i https://pypi.mirrors.ustc.edu.cn/simple/import cartopy.crs as ccrs
import cartopy.feature as cfeature
import matplotlib.pyplot as plt
import numpy as np
import xarray as xr
import metpy.calc as mpcalc
from metpy.cbook import get_test_data
from metpy.plots import add_metpy_logo, add_timestamp
from metpy.units import unitsmetpy
Функция потока Монтгомери (Montgomery Streamfunction) — это величина, которая часто необходима, поскольку ее градиент пропорционален геострофическому ветру в изэнтропическом пространстве. Это можно сделать с помощью mpcalc.montgomery_streamfunction метод легко рассчитывается.
Функция потока Монтгомери ((\Psi_m)) Это важная концепция в науке об атмосфере, особенно в анализе и прогнозировании погоды. Это определяется как:
в:
- (\Phi) — потенциальная энергия;
- (C_p) – удельная теплоемкость при постоянном давлении;
- (Т) – температура.
import xarray as xr
ds = xr.open_dataset('/home/mw/input/xinvert2128/atmos3D.nc')
print(ds)<xarray.Dataset> Size: 31MB
Dimensions: (LEV: 37, lat: 145, lon: 288)
Coordinates:
* LEV (LEV) int32 148B 1000 975 950 925 900 875 ... 200 175 150 125 100
* lat (lat) float32 580B 90.0 88.75 87.5 86.25 ... -87.5 -88.75 -90.0
* lon (lon) float32 1kB 0.0 1.25 2.5 3.75 5.0 ... 355.0 356.2 357.5 358.8
Data variables:
T (LEV, lat, lon) float32 6MB ...
U (LEV, lat, lon) float32 6MB ...
V (LEV, lat, lon) float32 6MB ...
hgt (LEV, lat, lon) float32 6MB ...
Omega (LEV, lat, lon) float32 6MB ...
psfc (lat, lon) float32 167kB ...
print(list(ds.variables))['time', 'lat', 'lon', 'u', 'v', 'div', 'vor', 'sf', 'vp']
msf = mpcalc.montgomery_streamfunction(
    ds['hgt'].sel(LEV=850),
    ds['T'].sel(LEV=850)
).data.to_base_units() * 1e-2
lon =ds.lon
lat =ds.lat
u = ds['U'].sel(LEV=850)
v = ds['V'].sel(LEV=850)
from meteva.base.tool.plot_tools import add_china_map_2basemap

bounds = [(80.,140., 15., 60.)]

fig = plt.figure(figsize=(17., 12.))
ax = plt.subplot(111, projection=ccrs.PlateCarree())
ax.set_extent(*bounds, crs=ccrs.PlateCarree())
# основной код
add_china_map_2basemap(ax, name="river", edgecolor='k', lw=0.5, encoding='gbk', grid0=None)  # "река"
add_china_map_2basemap(ax, name="nation",edgecolor='k', lw=0.5, encoding='gbk', grid0=None)  # «национальные границы»
add_china_map_2basemap(ax, name="province", edgecolor='k', lw=0.5, encoding='gbk', grid0=None)  # «граница провинции»

# Plot the surface
clevmsf = np.arange(0, 4000, 20)
cs = ax.contour(lon, lat, msf, clevmsf,
                colors='k', linewidths=1.0, linestyles='solid', transform=ccrs.PlateCarree())
cs.clabel(fontsize=10, inline=1, inline_spacing=7, fmt='%i', rightside_up=True,
          use_clabeltext=True)

# Plot RH
cf = ax.contourf(lon, lat, ds['T'].sel(LEV=850),
                 range(230, 300, 5), cmap=plt.cm.gist_earth_r, transform=ccrs.PlateCarree())
cb = fig.colorbar(cf, orientation='horizontal', aspect=65, shrink=0.5, pad=0.05,
                  extendrect='True')
cb.set_label('T', size='x-large')

barb_increments = {
    'half': 2,   # короткая полоса 2 m/s
    'full': 4,   # длинный бар 4 m/s
    'flag': 20   # вымпел 20 m/s
}

# Plot wind barbs
ax.barbs(lon.values, lat.values, u,
         v, length=6,
         regrid_shape=20, transform=ccrs.PlateCarree(),barb_increments=barb_increments)

fig.tight_layout()
plt.show()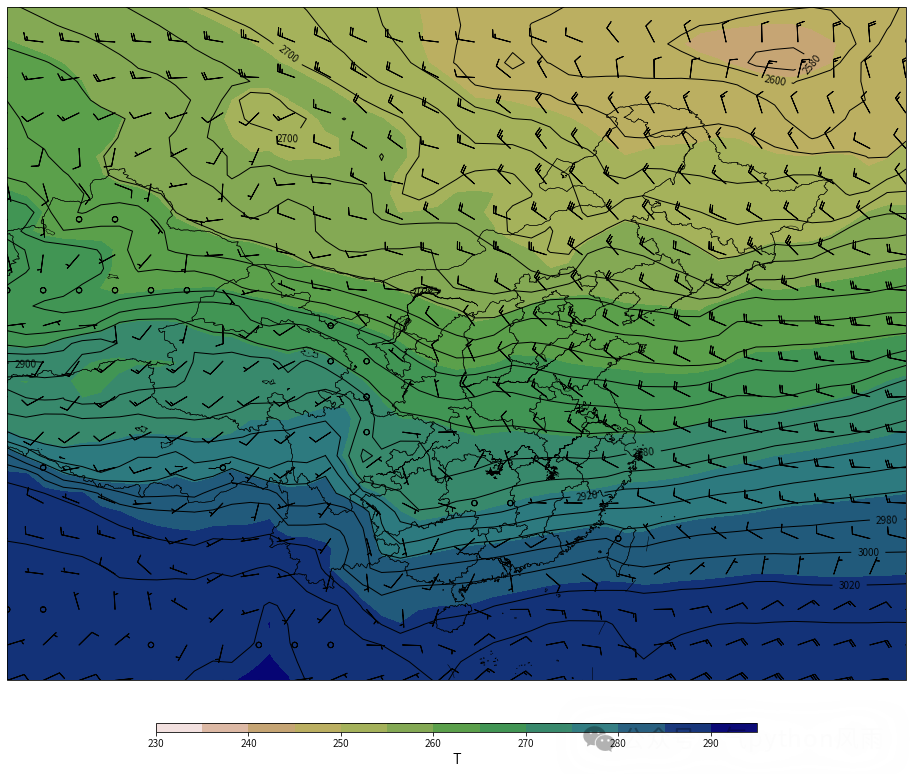
windspharm
Подробности конкретного процесса см. на https://mp.weixin.qq.com/s/UOGPev4e4Ebf6eBYfvQ_RA.
Этот метод имеет большие ограничения. Вот пример кода:
"""
Compute streamfunction and velocity potential from the long-term-mean
flow.

This example uses the standard interface.

Additional requirements for this example:

* netCDF4 (http://unidata.github.io/netcdf4-python/)
* matplotlib (http://matplotlib.org/)
* cartopy (http://scitools.org.uk/cartopy/)

"""
import cartopy.crs as ccrs
from cartopy.mpl.ticker import LongitudeFormatter, LatitudeFormatter
from cartopy.util import add_cyclic_point
import matplotlib as mpl
import matplotlib.pyplot as plt
from netCDF4 import Dataset

from windspharm.standard import VectorWind
from windspharm.tools import prep_data, recover_data, order_latdim
from windspharm.examples import example_data_path

mpl.rcParams['mathtext.default'] = 'regular'


# Read zonal and meridional wind components from file using the netCDF4
# module. The components are defined on pressure levels and are in separate
# files.
ncu = Dataset(example_data_path('uwnd_mean.nc'), 'r')
uwnd = ncu.variables['uwnd'][:]
lons = ncu.variables['longitude'][:]
lats = ncu.variables['latitude'][:]
ncu.close()
ncv = Dataset(example_data_path('vwnd_mean.nc'), 'r')
vwnd = ncv.variables['vwnd'][:]
ncv.close()

# The standard interface requires that latitude and longitude be the leading
# dimensions of the input wind components, and that wind components must be
# either 2D or 3D arrays. The data read in is 3D and has latitude and
# longitude as the last dimensions. The bundled tools can make the process of
# re-shaping the data a lot easier to manage.
uwnd, uwnd_info = prep_data(uwnd, 'tyx')
vwnd, vwnd_info = prep_data(vwnd, 'tyx')

# It is also required that the latitude dimension is north-to-south. Again the
# bundled tools make this easy.
lats, uwnd, vwnd = order_latdim(lats, uwnd, vwnd)

# Create a VectorWind instance to handle the computation of streamfunction and
# velocity potential.
w = VectorWind(uwnd, vwnd)

# Compute the streamfunction and velocity potential. Also use the bundled
# tools to re-shape the outputs to the 4D shape of the wind components as they
# were read off files.
sf, vp = w.sfvp()
sf = recover_data(sf, uwnd_info)
vp = recover_data(vp, uwnd_info)

# Pick out the field for December and add a cyclic point (the cyclic point is
# for plotting purposes).
sf_dec, lons_c = add_cyclic_point(sf[11], lons)
vp_dec, lons_c = add_cyclic_point(vp[11], lons)

# Plot streamfunction.
ax1 = plt.axes(projection=ccrs.PlateCarree(central_longitude=180))
clevs = [-120, -100, -80, -60, -40, -20, 0, 20, 40, 60, 80, 100, 120]
sf_fill = ax1.contourf(lons_c, lats, sf_dec * 1e-06, clevs,
                       transform=ccrs.PlateCarree(), cmap=plt.cm.RdBu_r,
                       extend='both')
ax1.coastlines()
ax1.gridlines()
ax1.set_xticks([0, 60, 120, 180, 240, 300, 359.99], crs=ccrs.PlateCarree())
ax1.set_yticks([-90, -60, -30, 0, 30, 60, 90], crs=ccrs.PlateCarree())
lon_formatter = LongitudeFormatter(zero_direction_label=True,
                                   number_format='.0f')
lat_formatter = LatitudeFormatter()
ax1.xaxis.set_major_formatter(lon_formatter)
ax1.yaxis.set_major_formatter(lat_formatter)
plt.colorbar(sf_fill, orientation='horizontal')
plt.title('Streamfunction ($10^6$m$^2$s$^{-1}$)', fontsize=16)

# Plot velocity potential.
plt.figure()
ax2 = plt.axes(projection=ccrs.PlateCarree(central_longitude=180))
clevs = [-10, -8, -6, -4, -2, 0, 2, 4, 6, 8, 10]
vp_fill = ax2.contourf(lons_c, lats, vp_dec * 1e-06, clevs,
                       transform=ccrs.PlateCarree(), cmap=plt.cm.RdBu_r,
                       extend='both')
ax2.coastlines()
ax2.gridlines()
ax2.set_xticks([0, 60, 120, 180, 240, 300, 359.99], crs=ccrs.PlateCarree())
ax2.set_yticks([-90, -60, -30, 0, 30, 60, 90], crs=ccrs.PlateCarree())
lon_formatter = LongitudeFormatter(zero_direction_label=True,
                                   number_format='.0f')
lat_formatter = LatitudeFormatter()
ax2.xaxis.set_major_formatter(lon_formatter)
ax2.yaxis.set_major_formatter(lat_formatter)
plt.colorbar(vp_fill, orientation='horizontal')
plt.title('Velocity Potential ($10^6$m$^2$s$^{-1}$)', fontsize=16)
plt.show()---------------------------------------------------------------------------
AttributeError Traceback (most recent call last)
Input In [57], in <cell line: 45>()
38 ncv.close()
40 # The standard interface requires that latitude and longitude be the leading
41 # dimensions of the input wind components, and that wind components must be
42 # either 2D or 3D arrays. The data read in is 3D and has latitude and
43 # longitude as the last dimensions. The bundled tools can make the process of
44 # re-shaping the data a lot easier to manage.
---> 45 uwnd, uwnd_info = prep_data(uwnd, 'tyx')
46 vwnd, vwnd_info = prep_data(vwnd, 'tyx')
48 # It is also required that the latitude dimension is north-to-south. Again the
49 # bundled tools make this easy.
File /opt/conda/lib/python3.9/site-packages/windspharm/tools.py:98, in prep_data(data, dimorder)
96 # Returns the prepared data and some data info to help data recovery.
97 pdata, intorder = __order_dims(data, dimorder)
---> 98 pdata, intshape = __reshape(pdata)
99 info = dict(intermediate_shape=intshape,
100 intermediate_order=intorder,
101 original_order=dimorder)
102 return pdata, info
File /opt/conda/lib/python3.9/site-packages/windspharm/tools.py:46, in __reshape(d)
45 def __reshape(d):
---> 46 out = d.reshape(d.shape[:2] + (np.prod(d.shape[2:], dtype=np.int),))
47 return out, d.shape
File /opt/conda/lib/python3.9/site-packages/numpy/__init__.py:324, in __getattr__(attr)
319 warnings.warn(
320 f"In the future `np.{attr}` will be defined as the "
321 "corresponding NumPy scalar.", FutureWarning, stacklevel=2)
323 if attr in __former_attrs__:
--> 324 raise AttributeError(__former_attrs__[attr])
326 if attr == 'testing':
327 import numpy.testing as testing
AttributeError: module 'numpy' has no attribute 'int'.
`np.int` was a deprecated alias for the builtin `int`. To avoid this error in existing code, use `int` by itself. Doing this will not modify any behavior and is safe. When replacing `np.int`, you may wish to use e.g. `np.int64` or `np.int32` to specify the precision. If you wish to review your current use, check the release note link for additional information.
The aliases was originally deprecated in NumPy 1.20; for more details and guidance see the original release note at:
https://numpy.org/devdocs/release/1.20.0-notes.html#deprecations
Очевидно, что даже если установка пройдет успешно, адаптацию других библиотек все равно придется решать, поэтому этот метод не рекомендуется.
xinvert
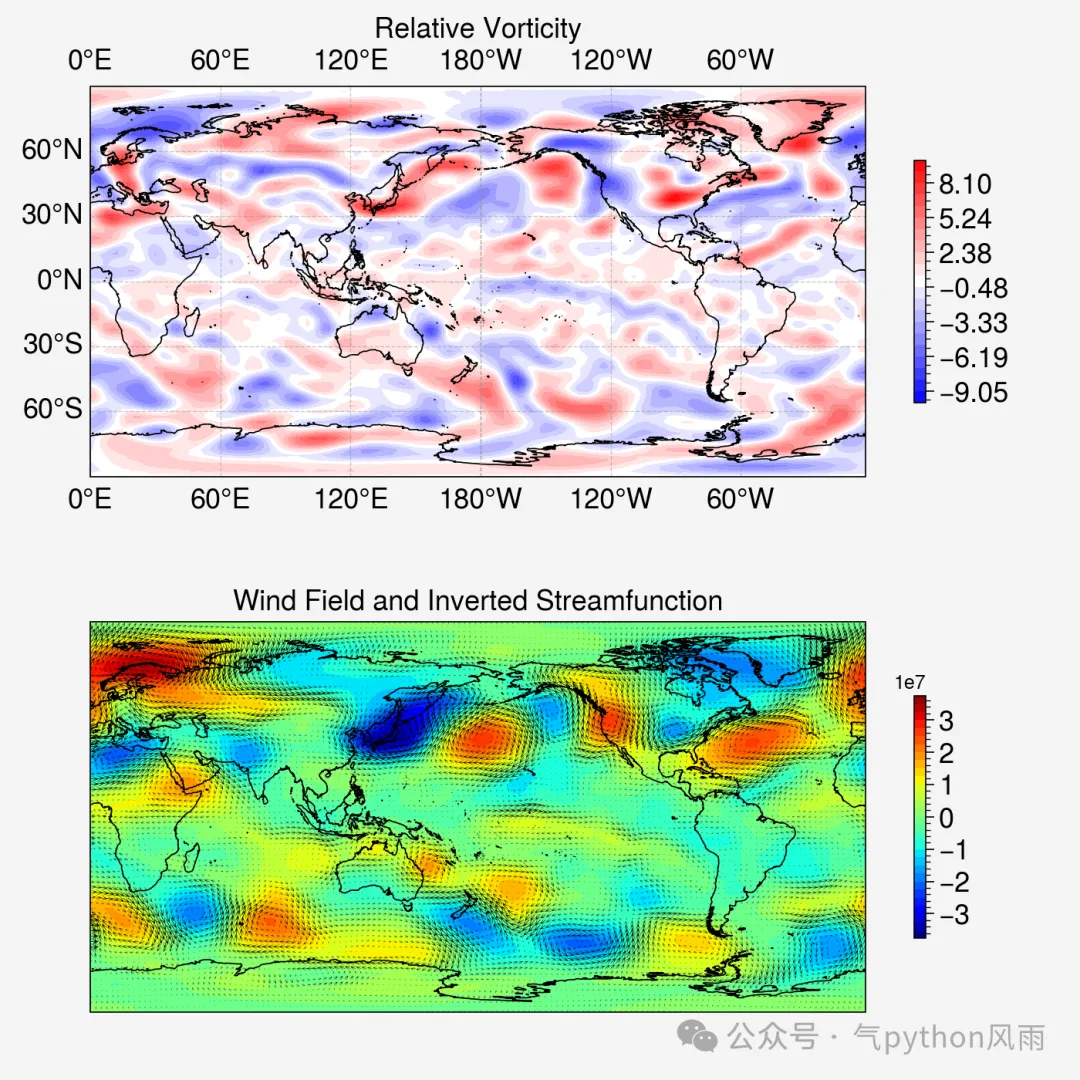
Решение функции тока из уравнения Пуассона для завихренности методом релаксационной итерации
import xarray as xr
ds  = xr.open_dataset('/home/mw/input/xinvert2128/Helmholtz_atmos.nc')
vor = ds.vor

print(ds)<xarray.Dataset> Size: 505kB
Dimensions: (time: 2, lat: 73, lon: 144)
Coordinates:
* time (time) datetime64[ns] 16B 2008-01-01 2008-01-02
* lat (lat) float32 292B -90.0 -87.5 -85.0 -82.5 ... 82.5 85.0 87.5 90.0
* lon (lon) float32 576B 0.0 2.5 5.0 7.5 10.0 ... 350.0 352.5 355.0 357.5
Data variables:
u (time, lat, lon) float32 84kB ...
v (time, lat, lon) float32 84kB ...
div (time, lat, lon) float32 84kB ...
vor (time, lat, lon) float32 84kB ...
sf (time, lat, lon) float32 84kB ...
vp (time, lat, lon) float32 84kB ...
Attributes:
comment: uwnd anomaly
storage: 99
title: plumb_flux
undef: 99999.0
pdef: None
from xinvert import invert_Poisson

iParams = {
    'BCs'      : ['extend', 'periodic'],
    'mxLoop'   : 1000,
    'tolerance': 1e-12,
}

sf = invert_Poisson(vor, dims=['lat','lon'], iParams=iParams){time: 2008-01-01T00:00:00} loops 1000 and tolerance is 5.164704e-09
{time: 2008-01-02T00:00:00} loops 1000 and tolerance is 6.395749e-09
import matplotlib.pyplot as plt
import cartopy.crs as ccrs
import cartopy.feature as cfeature
from matplotlib.ticker import FixedLocator, FuncFormatter
import xarray as xr
import numpy as np

# Определить форматировщик осей
def LONGITUDE_FORMATTER(x, pos=None):
    return f"{int(x)}°E" if x >= 0 else f"{abs(int(x))}°W"

def LATITUDE_FORMATTER(x, pos=None):
    return f"{int(x)}°N" if x >= 0 else f"{abs(int(x))}°S"

# Выберите первый временной шаг
u = ds.u.where(ds.u!=0)[0].load()
v = ds.v.where(ds.v!=0)[0].load()
m = np.hypot(u, v)

# Создайте график с двумя подграфиками
fig, axes = plt.subplots(nrows=2, ncols=1, figsize=(7, 7),
                         subplot_kw=dict(projection=ccrs.PlateCarree(central_longitude=180)))

# Установить размер шрифта
fontsize = 13

# добавить береговую линию
for ax in axes.flat:
    ax.add_feature(cfeature.COASTLINE.with_scale('50m'))

# Установить линии сетки
gl = axes[0].gridlines(draw_labels=True, linestyle='--', color='gray', alpha=0.5, linewidth=0.5)
gl.xlocator = FixedLocator(np.arange(-180, 181, 60))
gl.ylocator = FixedLocator(np.arange(-90, 91, 30))
gl.xformatter = FuncFormatter(LONGITUDE_FORMATTER)
gl.yformatter = FuncFormatter(LATITUDE_FORMATTER)
gl.xlabel_style = {'size': fontsize}
gl.ylabel_style = {'size': fontsize}

# график относительной завихренности
p = axes[0].contourf(u.lon, u.lat, vor[0]*1e5, cmap='bwr',
                     levels=np.linspace(-10, 10, 22),
                     transform=ccrs.PlateCarree())
axes[0].set_title('Relative Vorticity', fontsize=fontsize)
cb = fig.colorbar(p, ax=axes[0], orientation='vertical', shrink=0.5, pad=0.05)
cb.ax.tick_params(labelsize=fontsize)

# Картирование полей ветра и функции обратных потоков
p = axes[1].contourf(u.lon, u.lat, sf[0], levels=30, cmap='jet',
                     transform=ccrs.PlateCarree())
q = axes[1].quiver(u.lon.values, u.lat.values, u.values, v.values,
                   transform=ccrs.PlateCarree(),
                   width=0.0007, headwidth=12., headlength=15.)
axes[1].set_title('Wind Field and Inverted Streamfunction', fontsize=fontsize)
cb = fig.colorbar(p, ax=axes[1], orientation='vertical', shrink=0.5, pad=0.05)
cb.ax.tick_params(labelsize=fontsize)

plt.tight_layout()
plt.show()/opt/conda/lib/python3.9/site-packages/cartopy/crs.py:545: UserWarning: Some vectors at source domain corners may not have been transformed correctly
warnings.warn('Some vectors at source domain corners '
краткое содержание
Решений много, выберите то, которое подходит именно вам.
Если Python не может удовлетворить ваши потребности, вы можете посмотреть ncl или matlab.
Неразрушающее увеличение изображений одним щелчком мыши, чтобы сделать их более четкими артефактами искусственного интеллекта, включая руководства по установке и использованию.

Копикодер: этот инструмент отлично работает с Cursor, Bolt и V0! Предоставьте более качественные подсказки для разработки интерфейса (создание навигационного веб-сайта с использованием искусственного интеллекта).
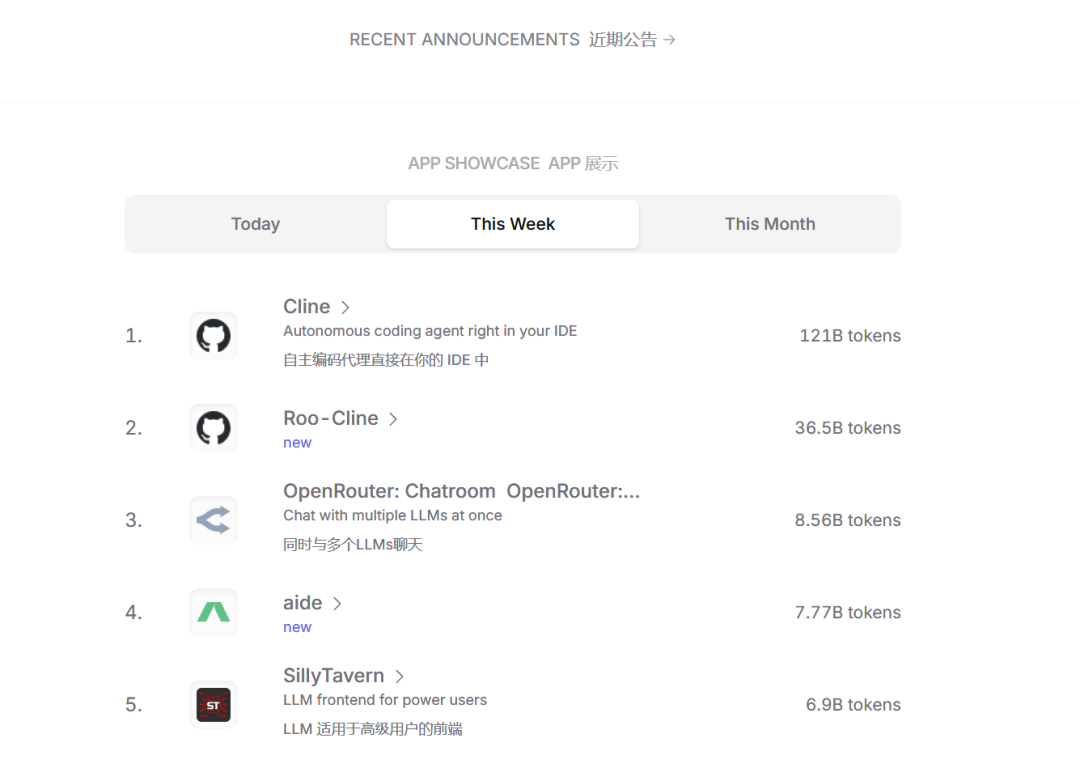
Новый бесплатный RooCline превосходит Cline v3.1? ! Быстрее, умнее и лучше вилка Cline! (Независимое программирование AI, порог 0)

Разработав более 10 проектов с помощью Cursor, я собрал 10 примеров и 60 подсказок.
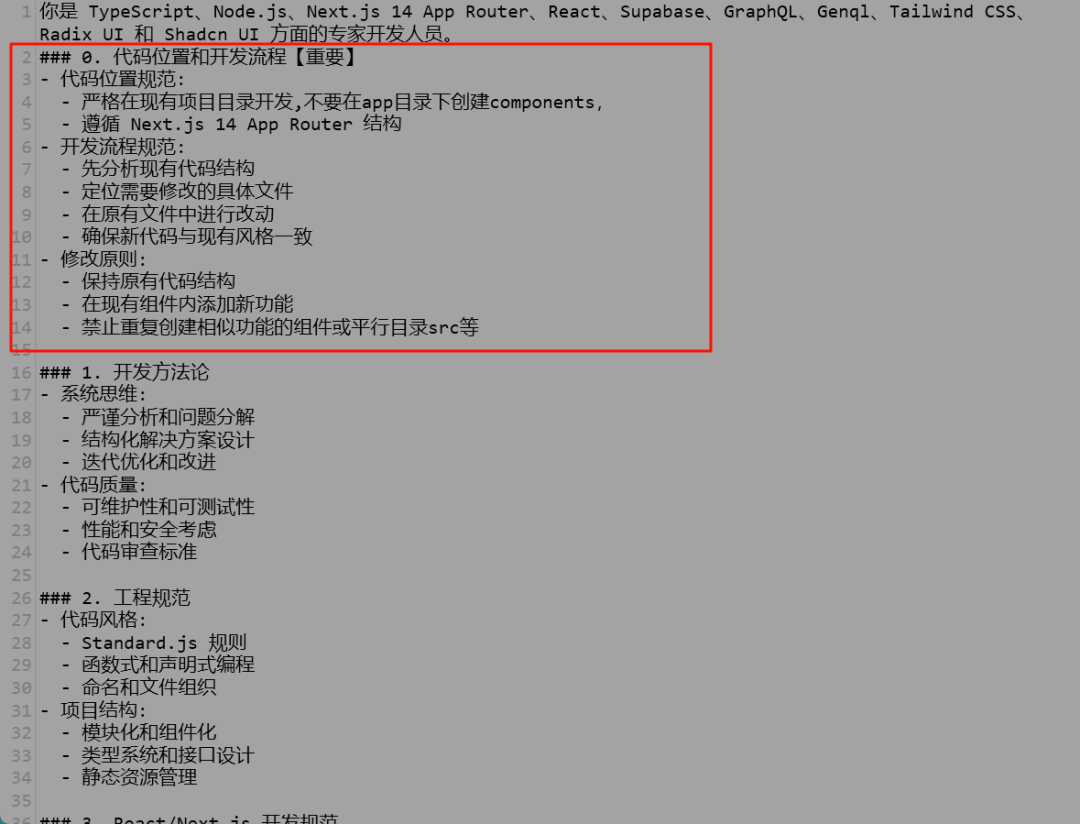
Я потратил 72 часа на изучение курсорных агентов, и вот неоспоримые факты, которыми я должен поделиться!
Идеальная интеграция Cursor и DeepSeek API

DeepSeek V3 снижает затраты на обучение больших моделей
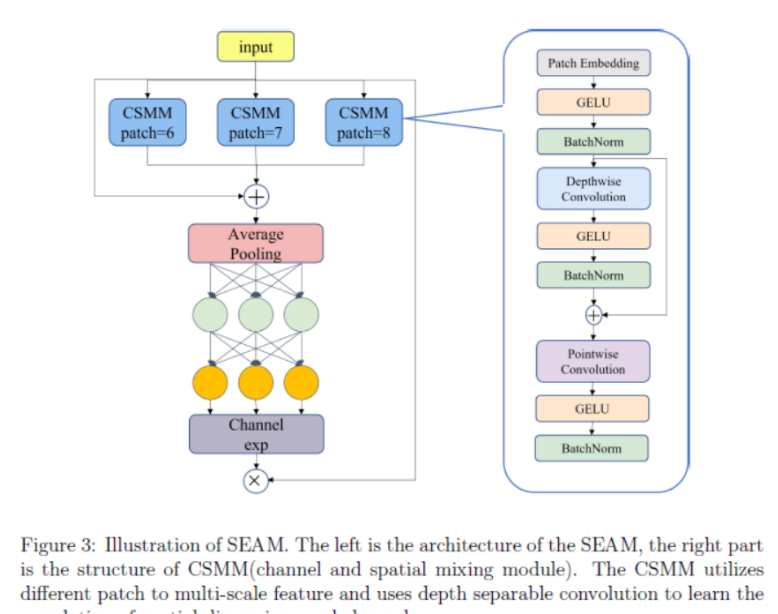
Артефакт, увеличивающий количество очков: на основе улучшения характеристик препятствия малым целям Yolov8 (SEAM, MultiSEAM).
DeepSeek V3 раскручивался уже три дня. Сегодня я попробовал самопровозглашенную модель «ChatGPT».

Open Devin — инженер-программист искусственного интеллекта с открытым исходным кодом, который меньше программирует и больше создает.
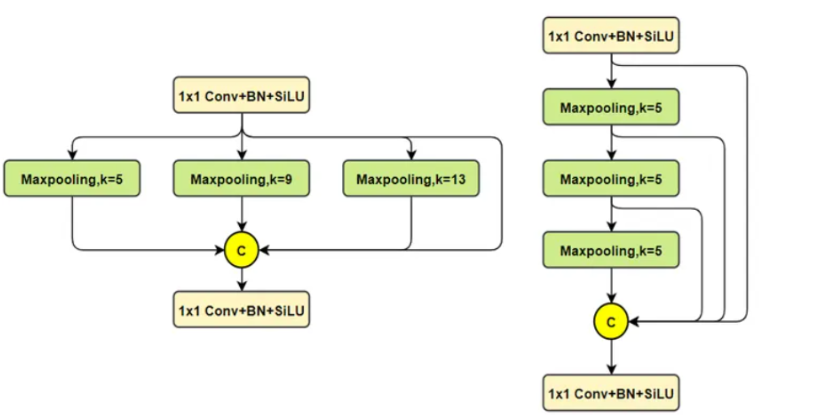
Эксклюзивное оригинальное улучшение YOLOv8: собственная разработка SPPF | SPPF сочетается с воспринимаемой большой сверткой ядра UniRepLK, а свертка с большим ядром + без расширения улучшает восприимчивое поле

Популярное и подробное объяснение DeepSeek-V3: от его появления до преимуществ и сравнения с GPT-4o.

9 основных словесных инструкций по доработке академических работ с помощью ChatGPT, эффективных и практичных, которые стоит собрать

Вызовите deepseek в vscode для реализации программирования с помощью искусственного интеллекта.

Познакомьтесь с принципами сверточных нейронных сетей (CNN) в одной статье (суперподробно)
50,3 тыс. звезд! Immich: автономное решение для резервного копирования фотографий и видео, которое экономит деньги и избавляет от беспокойства.
Cloud Native|Практика: установка Dashbaord для K8s, графика неплохая
Краткий обзор статьи — использование синтетических данных при обучении больших моделей и оптимизации производительности
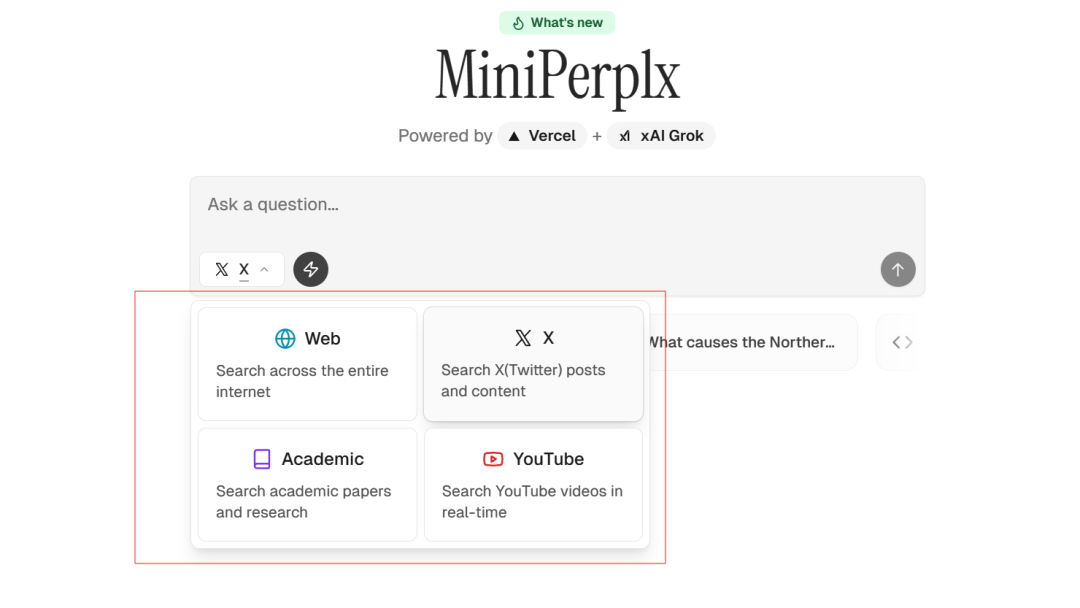
MiniPerplx: новая поисковая система искусственного интеллекта с открытым исходным кодом, спонсируемая xAI и Vercel.
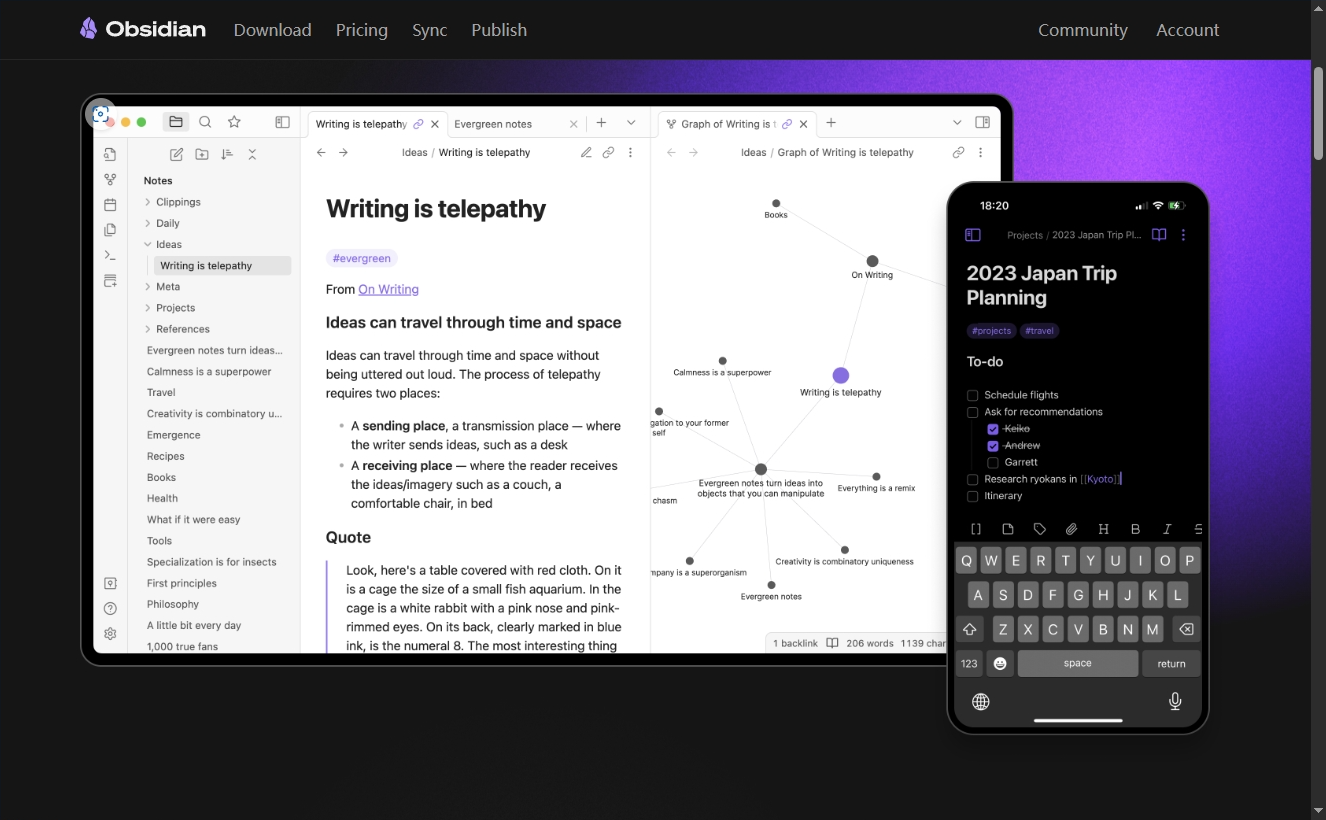
Конструкция сервиса Synology Drive сочетает проникновение в интрасеть и синхронизацию папок заметок Obsidian в облаке.
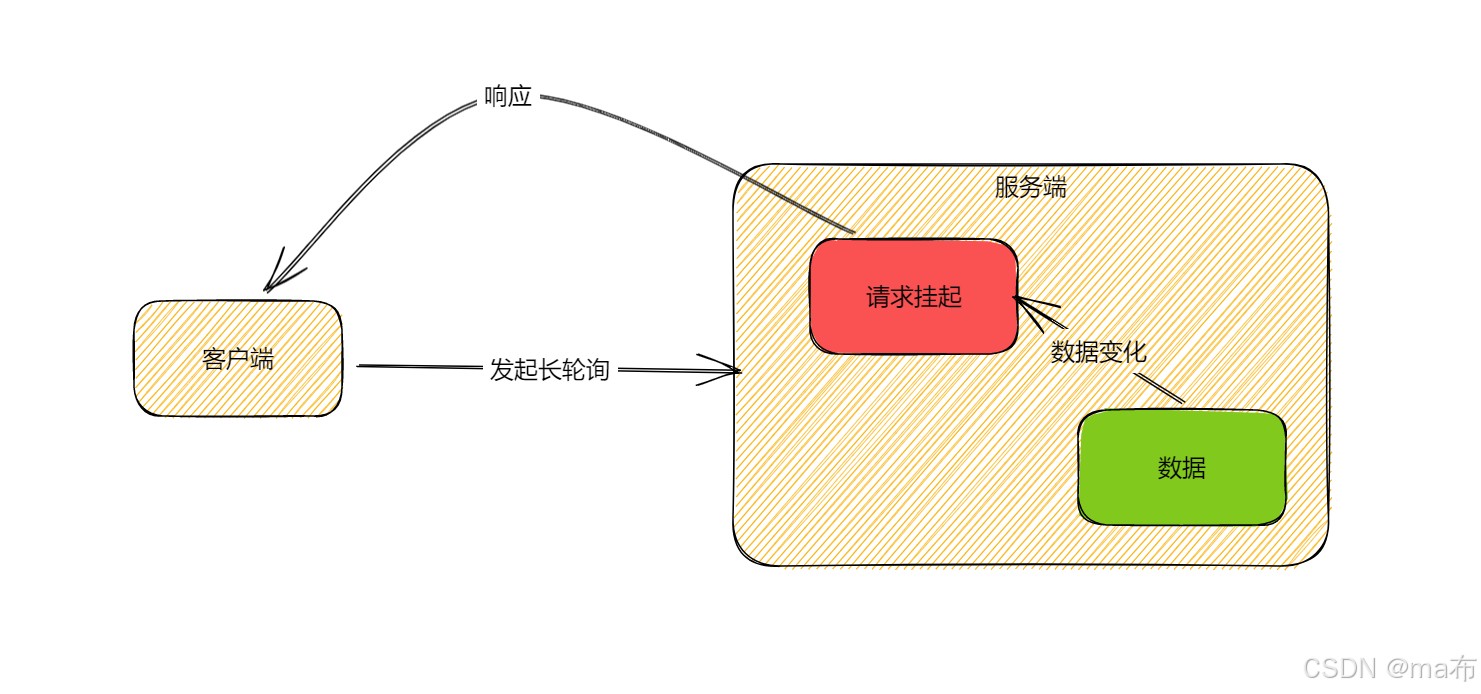
Центр конфигурации————Накос

Начинаем с нуля при разработке в облаке Copilot: начать разработку с минимальным использованием кода стало проще

[Серия Docker] Docker создает мультиплатформенные образы: практика архитектуры Arm64

Обновление новых возможностей coze | Я использовал coze для создания апплета помощника по исправлению домашних заданий по математике

Советы по развертыванию Nginx: практическое создание статических веб-сайтов на облачных серверах
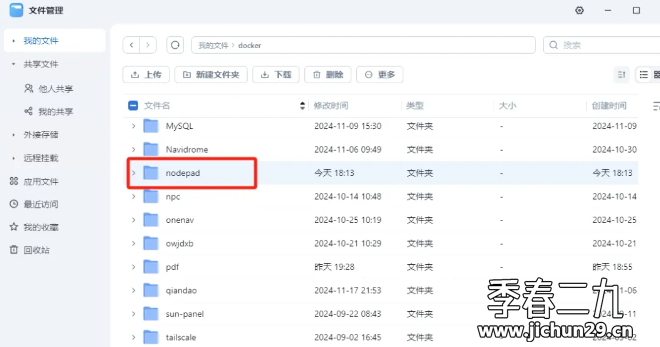
Feiniu fnos использует Docker для развертывания личного блокнота Notepad

Сверточная нейронная сеть VGG реализует классификацию изображений Cifar10 — практический опыт Pytorch
Начало работы с EdgeonePages — новым недорогим решением для хостинга веб-сайтов
[Зона легкого облачного игрового сервера] Управление игровыми архивами
