Радиолокационное обнаружение и моделирование MATLAB
Предисловие
В этой статье представлено содержание радиолокационного обнаружения в виде карты связей и объяснена реализация части моделирования.
1. Радиолокационное обнаружение
Интеллект-карта показана ниже. Если она вам нужна, перейдите в конец статьи, чтобы получить ее.

2. Моделирование в Matlab
1. Функции плотности вероятности Гаусса и Рэлея.
Функция плотности вероятности Рэлея:
Гауссова функция плотности вероятности:
это переменная,
это среднее значение,
это дисперсия
①, исходный код MATLAB
clear all
close all
xg = linspace(-6,6,1500); % randowm variable between -4 and 4
xr = linspace(0,6,1500); % randowm variable between 0 and 8
mu = 0; % zero mean Gaussain pdf mean
sigma = 1.5; % standard deviation (sqrt(variance)
ynorm = normpdf(xg,mu,sigma); % use MATLAB funtion normpdf
yray = raylpdf(xr,sigma); % use MATLAB function raylpdf
plot(xg,ynorm,'k',xr,yray,'k-.');
grid
legend('Gaussian pdf','Rayleigh pdf')
xlabel('x')
ylabel('Probability density')
gtext('\mu = 0; \sigma = 1.5')
gtext('\sigma =1.5')
②. Моделирование.

Плотности вероятности Гаусса и Рэлея
2. Кривая нормированного порога относительно вероятности ложной тревоги.
Вероятность ложной тревоги:
Пороговое напряжение:
Примечание:
пороговое напряжение,
это дисперсия
①, исходный код MATLAB
close all
clear all
logpfa = linspace(.01,250,1000);
var = 10.^(logpfa ./ 10.0);
vtnorm =  sqrt( log (var));
semilogx(logpfa, vtnorm,'k')
grid
②. Моделирование.
Абсцисса
Ордината

Нормализованный порог обнаружения в зависимости от вероятности ложной тревоги
Из рисунка хорошо видно, что
Очень чувствителен к небольшим изменениям порогового значения.
3. Кривая зависимости вероятности обнаружения относительно отношения сигнал/шум одиночного импульса
вероятность обнаружения
:

называется
функция.
①, исходный код MATLAB
marcumsq.m
function PD = marcumsq (a,b)
% This function uses Parl's method to compute PD
max_test_value = 5000.;
if (a < b)
   alphan0 = 1.0;
   dn = a / b;
else
   alphan0 = 0.;
   dn = b / a;
end
alphan_1 = 0.;
betan0 = 0.5;
betan_1 = 0.;
D1 = dn;
n = 0;
ratio = 2.0 / (a * b);
r1 = 0.0;
betan = 0.0;
alphan = 0.0;
while betan < 1000.,
   n = n + 1;
   alphan = dn + ratio * n * alphan0 + alphan;
   betan = 1.0 + ratio * n * betan0 + betan;
   alphan_1 = alphan0;
   alphan0 = alphan;
   betan_1 = betan0;
   betan0 = betan;
   dn = dn * D1;
end
PD = (alphan0 / (2.0 * betan0)) * exp( -(a-b)^2 / 2.0);
if ( a >= b)
   PD = 1.0 - PD;
end
return
prob_snr1.m
% This program is used to produce Fig. 2.4
close all
clear all
for nfa = 2:2:12
   b = sqrt(-2.0 * log(10^(-nfa)));
   index = 0;
   hold on
   for snr = 0:.1:18
      index = index +1;
      a = sqrt(2.0 * 10^(.1*snr));
      pro(index) = marcumsq(a,b);
   end
   x = 0:.1:18;
   set(gca,'ytick',[.1 .2 .3 .4 .5 .6  .7 .75 .8 .85 .9 ...
         .95 .9999])
   set(gca,'xtick',[1 2 3 4 5 6 7 8 9 10 11 12 13 14 15 16 17 18])

   loglog(x, pro,'k');
end
hold off
xlabel ('Single pulse SNR - dB')
ylabel ('Probability of detection')
grid
②. Моделирование.
Вероятность обнаружения относительно одиночного импульса
Кривая отношений для
ценностей:

6 кривых
Слева направо они
, можно видеть, что по мере увеличения отношения сигнал/шум вероятность обнаружения постепенно увеличивается. Кроме того, чем меньше вероятность ложной тревоги, тем быстрее увеличивается вероятность обнаружения по мере увеличения отношения сигнал/шум.
4. Кривая зависимости коэффициента улучшения и потерь накопления от количества некогерентных импульсов накопления.
совокупный коэффициент улучшения


① Кривая зависимости коэффициента улучшения от количества некогерентных накопленных импульсов.
1)MATLAB Исходный код
improv_fac.m
function impr_of_np = improv_fac (np, pfa, pd)
% This function computes the non-coherent integration improvment
% factor using the empirical formula defind in Eq. (2.48)
fact1 = 1.0 + log10( 1.0 / pfa) / 46.6;
fact2 = 6.79 * (1.0 + 0.253 * pd);
fact3 = 1.0 - 0.14 * log10(np) + 0.0183 * (log10(np))^2;
impr_of_np = fact1 * fact2 * fact3 * log10(np);
return
fig2_6a.m
% This program is used to produce Fig. 2.6a
% It uses the function "improv_fac"
clear all
close all
pfa1 = 1.0e-2;
pfa2 = 1.0e-6;
pfa3 = 1.0e-10;
pfa4 = 1.0e-13;
pd1 = .5;
pd2 = .8;
pd3 = .95;
pd4 = .999;
index = 0;
for np = 1:1:1000
   index = index + 1;
   I1(index) = improv_fac (np, pfa1, pd1);
   I2(index) = improv_fac (np, pfa2, pd2);
   I3(index) = improv_fac (np, pfa3, pd3);
   I4(index) = improv_fac (np, pfa4, pd4);
end
np = 1:1:1000;
semilogx (np, I1, 'k', np, I2, 'k--', np, I3, 'k-.', np, I4, 'k:')
%set (gca,'xtick',[1 2 3 4 5 6 7 8  10 20 30 100]);
xlabel ('Number of pulses');
ylabel ('Improvement factor in dB')
legend ('pd=.5, nfa=e+2','pd=.8, nfa=e+6','pd=.95, nfa=e+10','pd=.999, nfa=e+13');
grid
2) Моделирование

Коэффициент улучшения в зависимости от количества некогерентно накопленных импульсов
Видно, что по мере увеличения количества некогерентных накопленных импульсов коэффициент улучшения постепенно увеличивается при том же количестве импульсов, поскольку вероятность обнаружения и вероятность ложной тревоги также постепенно увеличиваются;
② Кривая зависимости между накопленными потерями и количеством некогерентных накопленных импульсов.
1)MATLAB Исходный код
% This program is used to produce Fig. 2.6b
% It uses the function "improv_fac".
clear all
close all
pfa1 = 1.0e-12;
pfa2 = 1.0e-12;
pfa3 = 1.0e-12;
pfa4 = 1.0e-12;
pd1 = .5;
pd2 = .8;
pd3 = .95;
pd4 = .99;
index = 0;
for np = 1:1:1000
    index = index+1;
    I1 = improv_fac (np, pfa1, pd1);
    i1 = 10.^(0.1*I1);
    L1(index) = -1*10*log10(i1 ./ np);
    I2 = improv_fac (np, pfa2, pd2);
    i2 = 10.^(0.1*I2);
    L2(index) = -1*10*log10(i2 ./ np);
    I3 = improv_fac (np, pfa3, pd3);
    i3 = 10.^(0.1*I3);
    L3(index) = -1*10*log10(i3 ./ np);
    I4 = improv_fac (np, pfa4, pd4);
    i4 = 10.^(0.1*I4);
    L4 (index) = -1*10*log10(i4 ./ np);
end
np = 1:1:1000;
semilogx (np, L1, 'k', np, L2, 'k--', np, L3, 'k-.', np, L4, 'k:')
axis tight
xlabel ('Number of pulses');
ylabel ('Integration loss - dB')
legend ('pd=.5, nfa=e+12','pd=.8, nfa=e+12','pd=.95, nfa=e+12','pd=.99, nfa=e+12');
grid
2) Моделирование

Зависимость потерь накопления от количества некогерентных импульсов накопления
Видно, что по мере увеличения количества некогерентных накопленных импульсов потери накопления постепенно увеличиваются при том же количестве импульсов, по мере увеличения вероятности обнаружения потери накопления будут постепенно уменьшаться;
5. Колеблющаяся вероятность обнаружения цели.
① Обнаружение вертящихся V-образных целей.
вероятность обнаружения
:

часвероятность обнаруженияотносительно SNR изгиб
1)MATLAB Исходный код
pd_swerling5.m
function pd = pd_swerling5 (input1, indicator, np, snrbar)
% This function is used to calculate the probability of detection
% for Swerling 5 or 0 targets for np>1.
if(np == 1)
   'Stop, np must be greater than 1'
   return
end
format long
snrbar = 10.0.^(snrbar./10.);
eps = 0.00000001;
delmax = .00001;
delta =10000.;
% Calculate the threshold Vt
if (indicator ~=1)
   nfa = input1;
   pfa =  np * log(2) / nfa;
else
   pfa = input1;
   nfa = np * log(2) / pfa;
end
sqrtpfa = sqrt(-log10(pfa));
sqrtnp = sqrt(np);
vt0 = np - sqrtnp + 2.3 * sqrtpfa * (sqrtpfa + sqrtnp - 1.0);
vt = vt0;
while (abs(delta) >= vt0)
   igf = incomplete_gamma(vt0,np);
   num = 0.5^(np/nfa) - igf;
   temp = (np-1) * log(vt0+eps) - vt0 - factor(np-1);
   deno = exp(temp);
   vt = vt0 + (num / (deno+eps));
   delta = abs(vt - vt0) * 10000.0;
   vt0 = vt;
end
% Calculate the Gram-Chrlier coeffcients
temp1 = 2.0 .* snrbar + 1.0;
omegabar = sqrt(np .* temp1);
c3 = -(snrbar + 1.0 / 3.0) ./ (sqrt(np) .* temp1.^1.5);
c4 = (snrbar + 0.25) ./ (np .* temp1.^2.);
c6 = c3 .* c3 ./2.0;
V = (vt - np .* (1.0 + snrbar)) ./ omegabar;
Vsqr = V .*V;
val1 = exp(-Vsqr ./ 2.0) ./ sqrt( 2.0 * pi);
val2 = c3 .* (V.^2 -1.0) + c4 .* V .* (3.0 - V.^2) -...
   c6 .* V .* (V.^4 - 10. .* V.^2 + 15.0);
q = 0.5 .* erfc (V./sqrt(2.0));
pd =  q - val1 .* val2;
fig2_9.m
close all
clear all
pfa = 1e-9;
nfa = log(2) / pfa;
b = sqrt(-2.0 * log(pfa));
index = 0;
for snr = 0:.1:20
   index = index +1;
   a = sqrt(2.0 * 10^(.1*snr));
   pro(index) = marcumsq(a,b);
   prob205(index) =  pd_swerling5 (pfa, 1, 10, snr);
end
x = 0:.1:20;
plot(x, pro,'k',x,prob205,'k:');
axis([0 20 0 1])
xlabel ('SNR - dB')
ylabel ('Probability of detection')
legend('np = 1','np = 10')
grid
2) Моделирование
часвероятность обнаруженияотносительно SNR изгиб

Обратите внимание, что для некогерентного накопления 10 импульсов требуется меньшее отношение сигнал/шум, чем для одного импульса, чтобы получить ту же вероятность обнаружения.
② Обнаружение целей Сверлинга I типа.
вероятность обнаружения
:


1)MATLAB Исходный код
pd_swerling2.m
function pd = pd_swerling2 (nfa, np, snrbar)
% This function is used to calculate the probability of detection
% for Swerling 2 targets.
format long
snrbar = 10.0^(snrbar/10.);
eps = 0.00000001;
delmax = .00001;
delta =10000.;
% Calculate the threshold Vt
pfa =  np * log(2) / nfa;
sqrtpfa = sqrt(-log10(pfa));
sqrtnp = sqrt(np);
vt0 = np - sqrtnp + 2.3 * sqrtpfa * (sqrtpfa + sqrtnp - 1.0);
vt = vt0;
while (abs(delta) >= vt0)
   igf = incomplete_gamma(vt0,np);
   num = 0.5^(np/nfa) - igf;
   temp = (np-1) * log(vt0+eps) - vt0 - factor(np-1);
   deno = exp(temp);
   vt = vt0 + (num / (deno+eps));
   delta = abs(vt - vt0) * 10000.0;
   vt0 = vt;
end
if (np <= 50)
   temp = vt / (1.0 + snrbar);
   pd = 1.0 - incomplete_gamma(temp,np);
   return
else
   temp1 = snrbar + 1.0;
   omegabar = sqrt(np) * temp1;
   c3 = -1.0 / sqrt(9.0 * np);
   c4 = 0.25 / np;
   c6 = c3 * c3 /2.0;
   V = (vt - np * temp1) / omegabar;
   Vsqr = V *V;
   val1 = exp(-Vsqr / 2.0) / sqrt( 2.0 * pi);
   val2 = c3 * (V^2 -1.0) + c4 * V * (3.0 - V^2) - ...
      c6 * V * (V^4 - 10. * V^2 + 15.0);
   q = 0.5 * erfc (V/sqrt(2.0));
   pd =  q - val1 * val2;
end
fig2_10.m
clear all
pfa = 1e-9;
nfa = log(2) / pfa;
b = sqrt(-2.0 * log(pfa));
index = 0;
for snr = 0:.01:22
   index = index +1;
   a = sqrt(2.0 * 10^(.1*snr));
   pro(index) = marcumsq(a,b);
   prob(index) =  pd_swerling2 (nfa, 1, snr);
end
x = 0:.01:22;
%figure(10)
plot(x, pro,'k',x,prob,'k:');
axis([2 22 0 1])
xlabel ('SNR - dB')
ylabel ('Probability of detection')
legend('Swerling V','Swerling I')
grid
2) Моделирование
вероятность обнаруженияотносительно SNR, одиночный импульс,
:

Видно, что для того, чтобы получить то же, что и в безфлуктуационном случае
, когда есть взлеты и падения, требуется более высокий SNR.
3)MATLAB Исходный код
pd_swerling1.m
function pd = pd_swerling1 (nfa, np, snrbar)
% This function is used to calculate the probability of detection
% for Swerling 1 targets.
format long
snrbar = 10.0^(snrbar/10.);
eps = 0.00000001;
delmax = .00001;
delta =10000.;
% Calculate the threshold Vt
pfa =  np * log(2) / nfa;
sqrtpfa = sqrt(-log10(pfa));
sqrtnp = sqrt(np);
vt0 = np - sqrtnp + 2.3 * sqrtpfa * (sqrtpfa + sqrtnp - 1.0);
vt = vt0;
while (abs(delta) >= vt0)
   igf = incomplete_gamma(vt0,np);
   num = 0.5^(np/nfa) - igf;
   temp = (np-1) * log(vt0+eps) - vt0 - factor(np-1);
   deno = exp(temp);
   vt = vt0 + (num / (deno+eps));
   delta = abs(vt - vt0) * 10000.0;
   vt0 = vt;
end
if (np == 1)
   temp = -vt / (1.0 + snrbar);
   pd = exp(temp);
   return
end
   temp1 = 1.0 + np * snrbar;
   temp2 = 1.0 / (np *snrbar);
   temp = 1.0 + temp2;
   val1 = temp^(np-1.);
   igf1 = incomplete_gamma(vt,np-1);
   igf2 = incomplete_gamma(vt/temp,np-1);
   pd = 1.0 - igf1 + val1 * igf2 * exp(-vt/temp1);
fig2_11ab.m
clear all
pfa = 1e-11;
nfa = log(2) / pfa;
index = 0;
for snr = -10:.5:30
   index = index +1;
   prob1(index) =  pd_swerling1 (nfa, 1, snr);
   prob10(index) =  pd_swerling1 (nfa, 10, snr);
   prob50(index) =  pd_swerling1 (nfa, 50, snr);
   prob100(index) =  pd_swerling1 (nfa, 100, snr);
end
x = -10:.5:30;
plot(x, prob1,'k',x,prob10,'k:',x,prob50,'k--', ...
   x, prob100,'k-.');
axis([-10 30 0 1])
xlabel ('SNR - dB')
ylabel ('Probability of detection')
legend('np = 1','np = 10','np = 50','np = 100')
grid
4) Моделирование
вероятность обнаруженияотносительно SNR,Swerling Ⅰ,

На картинке выше показано
час,вероятность обнаруженияотносительно SNR изгибы, среди которых
, ты можешь видеть
Чем больше, тем достигаются одни и те же возможности обнаруженияиз SNR Чем меньше.
③ Обнаружение целей Сверлинга II типа.
вероятность обнаружения
:

когда
час:

в это время:

1)MATLAB Исходный код
fig2_12.m
clear all
pfa = 1e-10;
nfa = log(2) / pfa;
index = 0;
for snr = -10:.5:30
   index = index +1;
   prob1(index) =  pd_swerling2 (nfa, 1, snr);
   prob10(index) =  pd_swerling2 (nfa, 10, snr);
   prob50(index) =  pd_swerling2 (nfa, 50, snr);
   prob100(index) =  pd_swerling2 (nfa, 100, snr);
end
x = -10:.5:30;
plot(x, prob1,'k',x,prob10,'k:',x,prob50,'k--', ...
   x, prob100,'k-.');
axis([-10 30 0 1])
xlabel ('SNR - dB')
ylabel ('Probability of detection')
legend('np = 1','np = 10','np = 50','np = 100')
grid
2) Моделирование
вероятность обнаруженияотносительно SNR,Swerling Ⅱ,

На картинке выше показано, когда
час,вероятность обнаружениякак SNR функцияизгибы, среди которых
④ Обнаружение целей Сверлинга III типа.
вероятность обнаружения
:
час:

час:

1)MATLAB Исходный код
pd_swerling3.m
function pd = pd_swerling3 (nfa, np, snrbar)
% This function is used to calculate the probability of detection
% for Swerling 2 targets.
format long
snrbar = 10.0^(snrbar/10.);
eps = 0.00000001;
delmax = .00001;
delta =10000.;
% Calculate the threshold Vt
pfa =  np * log(2) / nfa;
sqrtpfa = sqrt(-log10(pfa));
sqrtnp = sqrt(np);
vt0 = np - sqrtnp + 2.3 * sqrtpfa * (sqrtpfa + sqrtnp - 1.0);
vt = vt0;
while (abs(delta) >= vt0)
   igf = incomplete_gamma(vt0,np);
   num = 0.5^(np/nfa) - igf;
   temp = (np-1) * log(vt0+eps) - vt0 - factor(np-1);
   deno = exp(temp);
   vt = vt0 + (num / (deno+eps));
   delta = abs(vt - vt0) * 10000.0;
   vt0 = vt;
end
temp1 = vt / (1.0 + 0.5 * np *snrbar);
temp2 = 1.0 + 2.0 / (np * snrbar);
temp3 = 2.0 * (np - 2.0) / (np * snrbar);
ko = exp(-temp1) * temp2^(np-2.) * (1.0 + temp1 - temp3);
if (np <= 2)
   pd = ko;
   return
else
   temp4 = vt^(np-1.) * exp(-vt) / (temp1 * exp(factor(np-2.)));
   temp5 =  vt / (1.0 + 2.0 / (np *snrbar));
   pd = temp4 + 1.0 - incomplete_gamma(vt,np-1.) + ko * ...
      incomplete_gamma(temp5,np-1.);
end
fig2_13.m
clear all
pfa = 1e-9;
nfa = log(2) / pfa;
index = 0;
for snr = -10:.5:30
   index = index +1;
   prob1(index) =  pd_swerling3 (nfa, 1, snr);
   prob10(index) =  pd_swerling3 (nfa, 10, snr);
   prob50(index) =  pd_swerling3(nfa, 50, snr);
   prob100(index) =  pd_swerling3 (nfa, 100, snr);
end
x = -10:.5:30;
plot(x, prob1,'k',x,prob10,'k:',x,prob50,'k--', ...
   x, prob100,'k-.');
axis([-10 30 0 1])
xlabel ('SNR - dB')
ylabel ('Probability of detection')
legend('np = 1','np = 10','np = 50','np = 100')
grid
2) Моделирование
вероятность обнаруженияотносительно SNR,Swerling Ⅲ,

На картинке выше показано, когда
час,вероятность обнаружениякак SNR функцияизгибы, среди которых
⑤ Обнаружение целей Сверлинга типа IV.
вероятность обнаружения
:
час:

когда
час:

в это время:

1)MATLAB Исходный код
pd_swerling4.m
function pd = pd_swerling4 (nfa, np, snrbar)
% This function is used to calculate the probability of detection
% for Swerling 4 targets.
format long
snrbar = 10.0^(snrbar/10.);
eps = 0.00000001;
delmax = .00001;
delta =10000.;
% Calculate the threshold Vt
pfa =  np * log(2) / nfa;
sqrtpfa = sqrt(-log10(pfa));
sqrtnp = sqrt(np);
vt0 = np - sqrtnp + 2.3 * sqrtpfa * (sqrtpfa + sqrtnp - 1.0);
vt = vt0;
while (abs(delta) >= vt0)
   igf = incomplete_gamma(vt0,np);
   num = 0.5^(np/nfa) - igf;
   temp = (np-1) * log(vt0+eps) - vt0 - factor(np-1);
   deno = exp(temp);
   vt = vt0 + (num / (deno+eps));
   delta = abs(vt - vt0) * 10000.0;
   vt0 = vt;
end
h8 = snrbar /2.0;
beta = 1.0 + h8;
beta2 = 2.0 * beta^2 - 1.0;
beta3 = 2.0 * beta^3;
if (np >= 50)
   temp1 = 2.0 * beta -1;
   omegabar = sqrt(np * temp1);
   c3 = (beta3 - 1.) / 3.0 / beta2 / omegabar;
   c4 = (beta3 * beta3 - 1.0) / 4. / np /beta2 /beta2;;
   c6 = c3 * c3 /2.0;
   V = (vt - np * (1.0 + snrbar)) / omegabar;
   Vsqr = V *V;
   val1 = exp(-Vsqr / 2.0) / sqrt( 2.0 * pi);
   val2 = c3 * (V^2 -1.0) + c4 * V * (3.0 - V^2) - ...
      c6 * V * (V^4 - 10. * V^2 + 15.0);
   q = 0.5 * erfc (V/sqrt(2.0));
   pd =  q - val1 * val2;
   return
else
   snr = 1.0;
   gamma0 = incomplete_gamma(vt/beta,np);
   a1 = (vt / beta)^np / (exp(factor(np)) * exp(vt/beta));
   sum = gamma0;
   for i = 1:1:np
      temp1 = 1;
      if (i == 1)
         ai = a1;
      else
         ai = (vt / beta) * a1 / (np + i -1);
      end
      a1 = ai;
      gammai = gamma0 - ai;
      gamma0 = gammai;
      a1 = ai;

      for ii = 1:1:i
         temp1 = temp1 * (np + 1 - ii);
      end
      term = (snrbar /2.0)^i * gammai * temp1 / exp(factor(i));
      sum = sum + term;
   end
   pd = 1.0 - sum / beta^np;
end
pd = max(pd,0.);
fig2_14.m
clear all
pfa = 1e-9;
nfa = log(2) / pfa;
index = 0;
for snr = -10:.5:30
   index = index +1;
   prob1(index) =  pd_swerling4 (nfa, 1, snr);
   prob10(index) =  pd_swerling4 (nfa, 10, snr);
   prob50(index) =  pd_swerling4(nfa, 50, snr);
   prob100(index) =  pd_swerling4 (nfa, 100, snr);
end
x = -10:.5:30;
plot(x, prob1,'k',x,prob10,'k:',x,prob50,'k--', ...
   x, prob100,'k-.');
axis([-10 30 0 1.1])
xlabel ('SNR - dB')
ylabel ('Probability of detection')
legend('np = 1','np = 10','np = 50','np = 100')
grid
axis tight
2) Моделирование
вероятность обнаруженияотносительно SNR,Swerling Ⅳ,

На картинке выше показано, когда
час,вероятность обнаружениякак SNR функцияизгибы, среди которых
Неразрушающее увеличение изображений одним щелчком мыши, чтобы сделать их более четкими артефактами искусственного интеллекта, включая руководства по установке и использованию.

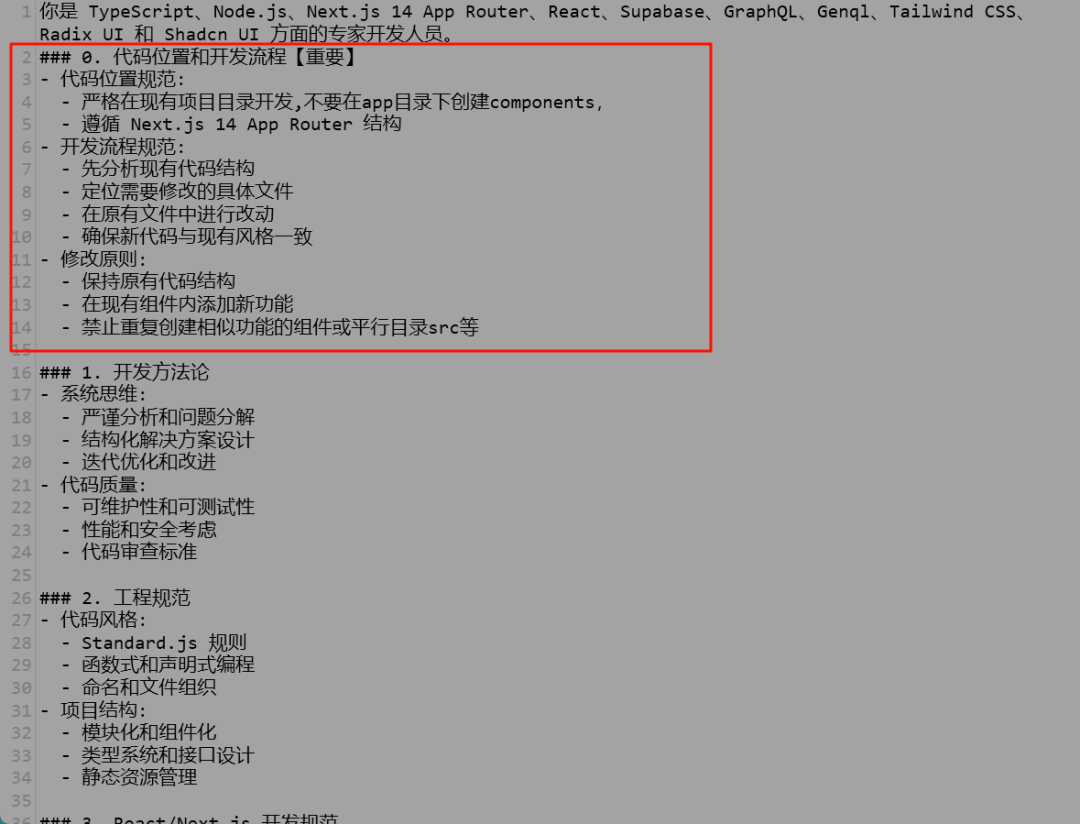
Копикодер: этот инструмент отлично работает с Cursor, Bolt и V0! Предоставьте более качественные подсказки для разработки интерфейса (создание навигационного веб-сайта с использованием искусственного интеллекта).

Новый бесплатный RooCline превосходит Cline v3.1? ! Быстрее, умнее и лучше вилка Cline! (Независимое программирование AI, порог 0)

Разработав более 10 проектов с помощью Cursor, я собрал 10 примеров и 60 подсказок.
Я потратил 72 часа на изучение курсорных агентов, и вот неоспоримые факты, которыми я должен поделиться!
Идеальная интеграция Cursor и DeepSeek API

DeepSeek V3 снижает затраты на обучение больших моделей
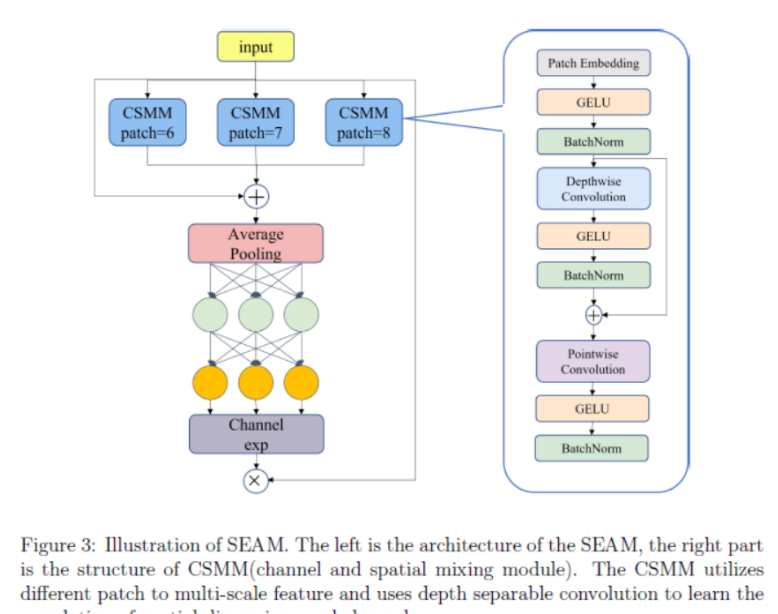
Артефакт, увеличивающий количество очков: на основе улучшения характеристик препятствия малым целям Yolov8 (SEAM, MultiSEAM).

DeepSeek V3 раскручивался уже три дня. Сегодня я попробовал самопровозглашенную модель «ChatGPT».

Open Devin — инженер-программист искусственного интеллекта с открытым исходным кодом, который меньше программирует и больше создает.
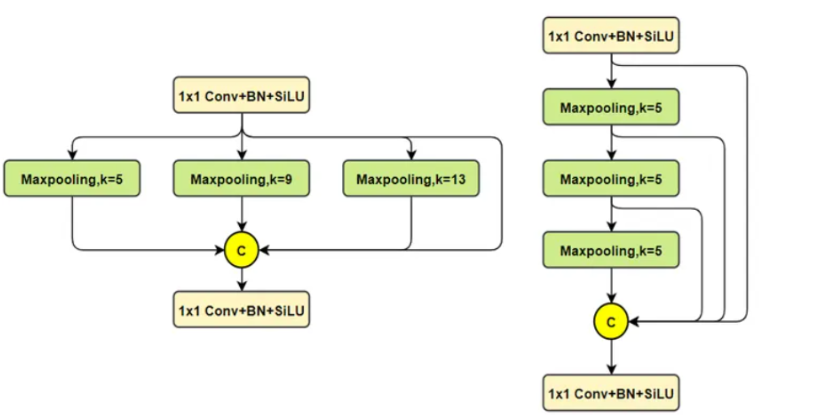
Эксклюзивное оригинальное улучшение YOLOv8: собственная разработка SPPF | SPPF сочетается с воспринимаемой большой сверткой ядра UniRepLK, а свертка с большим ядром + без расширения улучшает восприимчивое поле

Популярное и подробное объяснение DeepSeek-V3: от его появления до преимуществ и сравнения с GPT-4o.

9 основных словесных инструкций по доработке академических работ с помощью ChatGPT, эффективных и практичных, которые стоит собрать

Вызовите deepseek в vscode для реализации программирования с помощью искусственного интеллекта.

Познакомьтесь с принципами сверточных нейронных сетей (CNN) в одной статье (суперподробно)

50,3 тыс. звезд! Immich: автономное решение для резервного копирования фотографий и видео, которое экономит деньги и избавляет от беспокойства.
Cloud Native|Практика: установка Dashbaord для K8s, графика неплохая
Краткий обзор статьи — использование синтетических данных при обучении больших моделей и оптимизации производительности

MiniPerplx: новая поисковая система искусственного интеллекта с открытым исходным кодом, спонсируемая xAI и Vercel.

Конструкция сервиса Synology Drive сочетает проникновение в интрасеть и синхронизацию папок заметок Obsidian в облаке.
Центр конфигурации————Накос

Начинаем с нуля при разработке в облаке Copilot: начать разработку с минимальным использованием кода стало проще

[Серия Docker] Docker создает мультиплатформенные образы: практика архитектуры Arm64

Обновление новых возможностей coze | Я использовал coze для создания апплета помощника по исправлению домашних заданий по математике

Советы по развертыванию Nginx: практическое создание статических веб-сайтов на облачных серверах

Feiniu fnos использует Docker для развертывания личного блокнота Notepad

Сверточная нейронная сеть VGG реализует классификацию изображений Cifar10 — практический опыт Pytorch
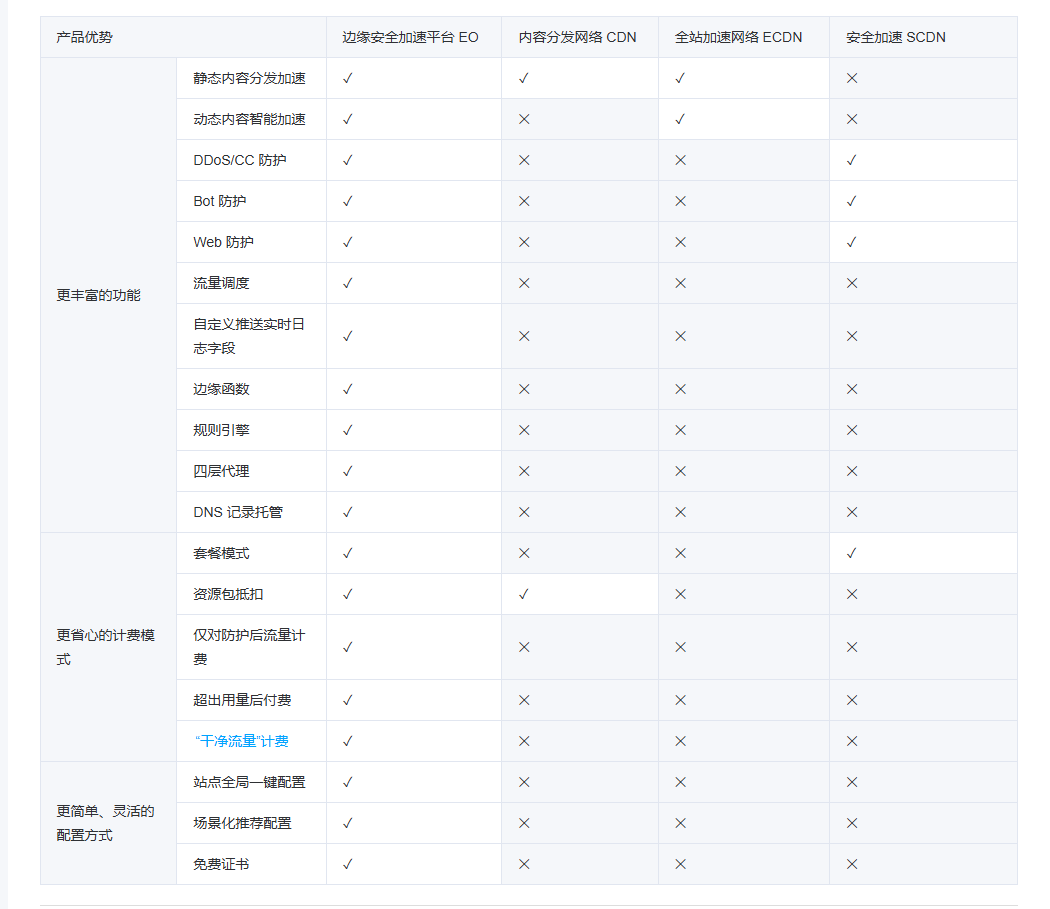
Начало работы с EdgeonePages — новым недорогим решением для хостинга веб-сайтов
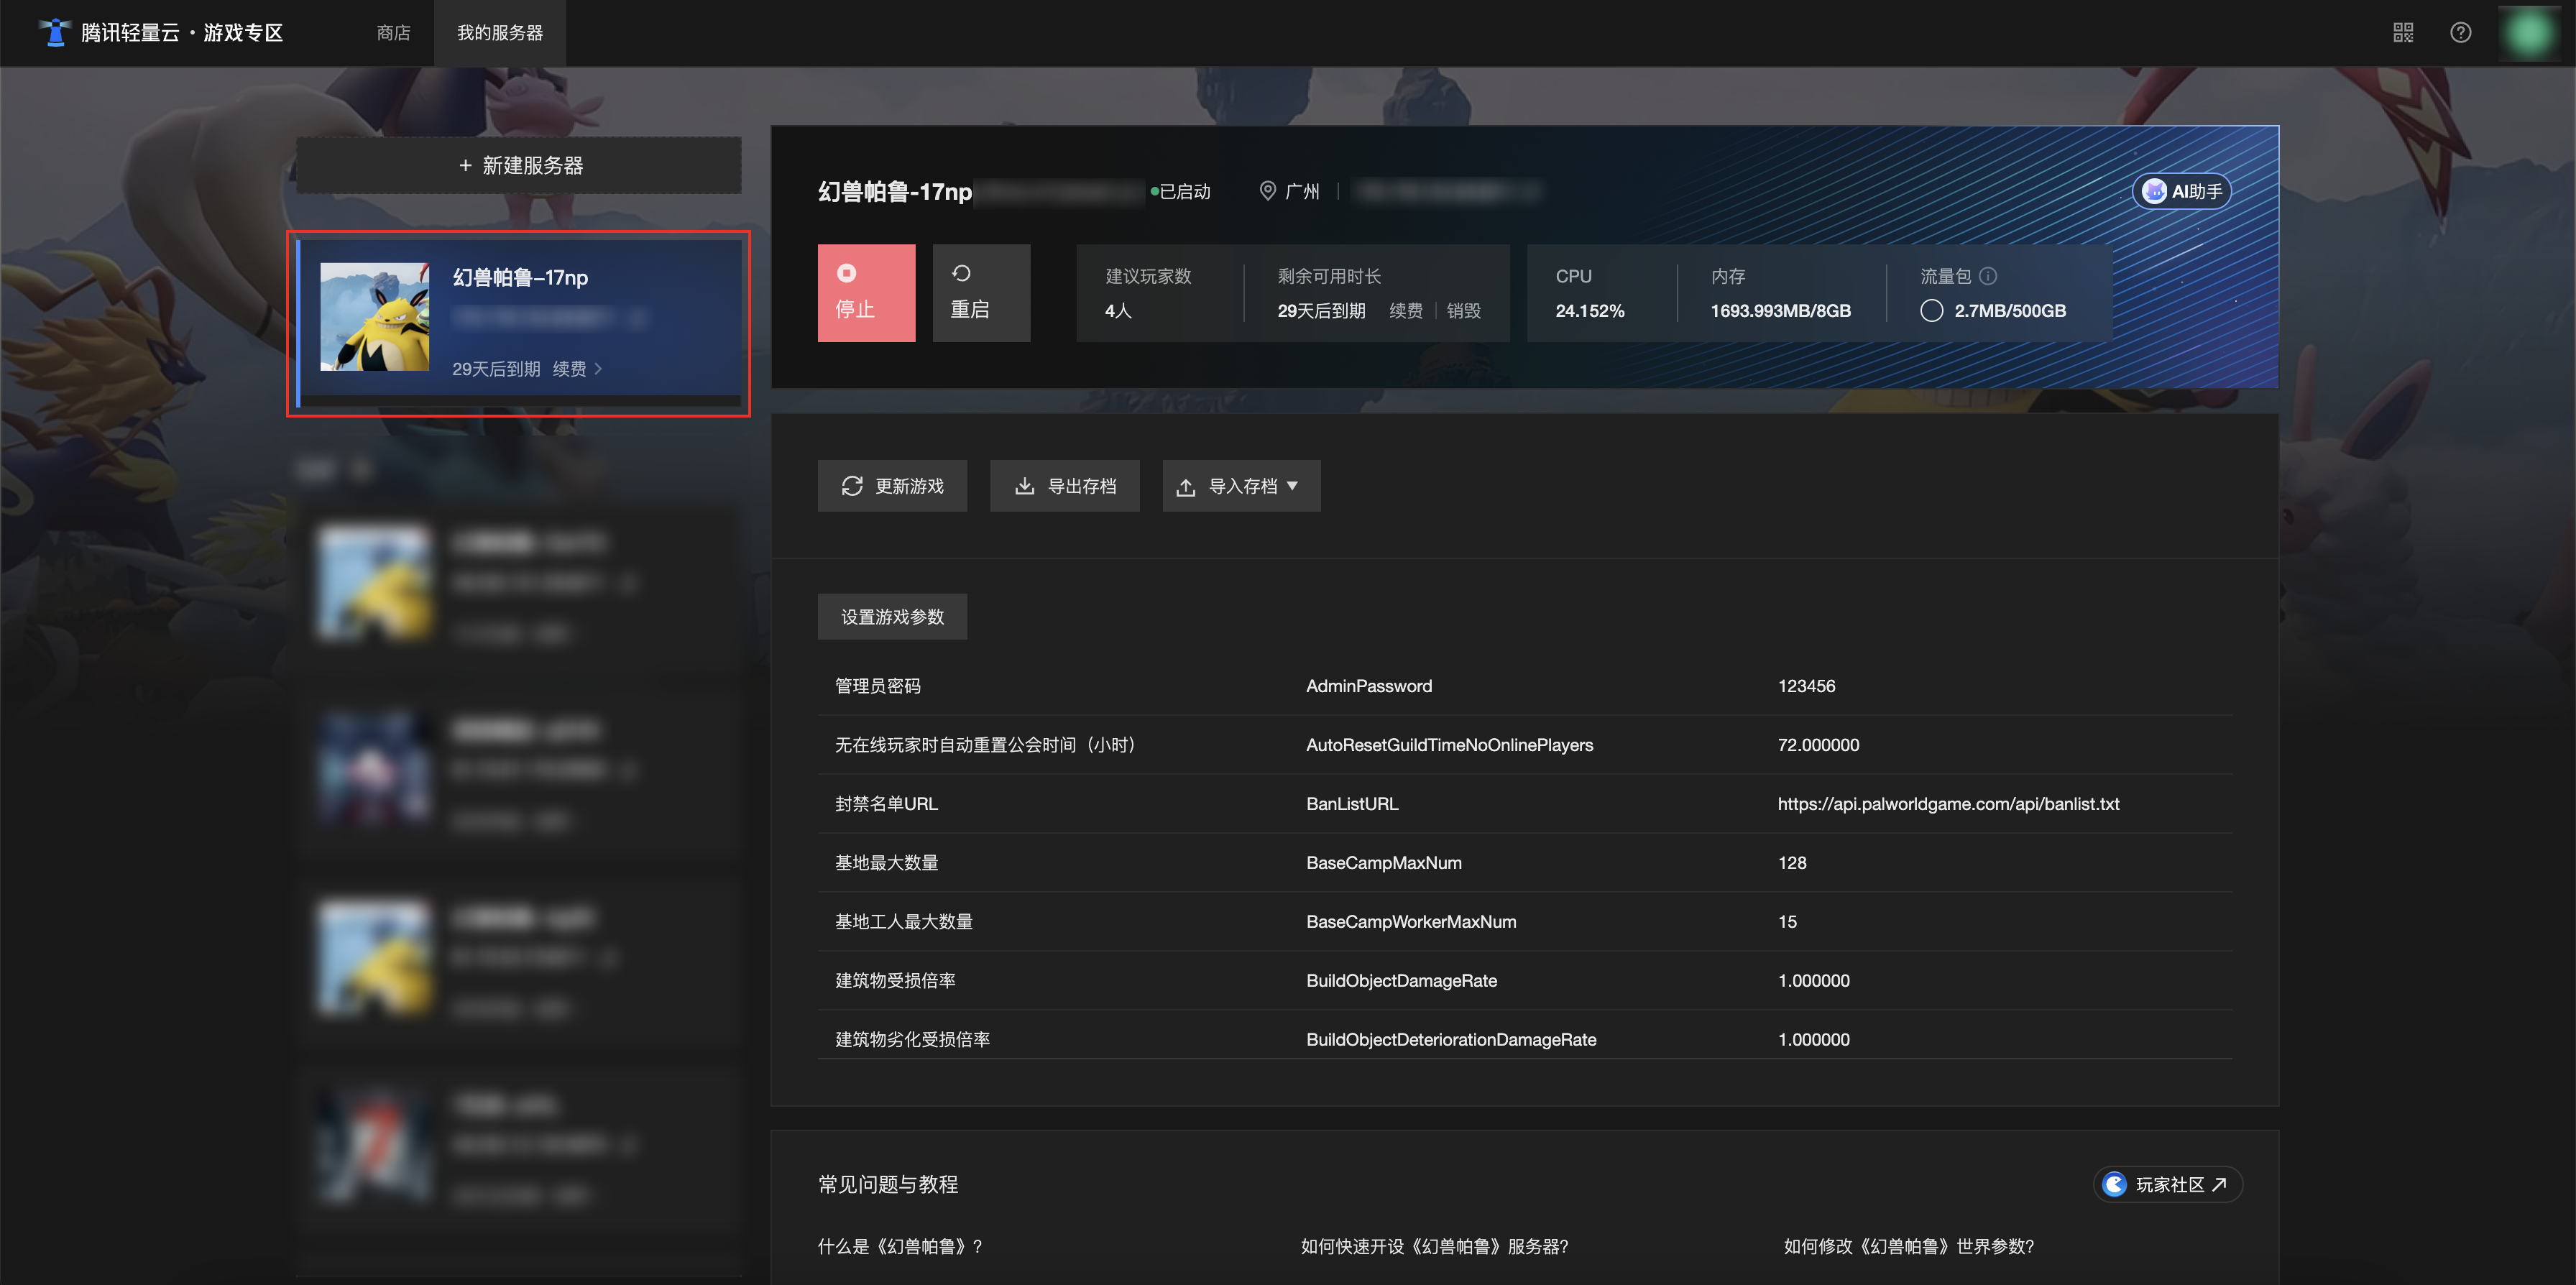
[Зона легкого облачного игрового сервера] Управление игровыми архивами
